Gold technical analysis helps traders understand XAUUSD price movements by studying charts, market trends, and technical indicators. Popular tools include moving averages, RSI, MACD, Bollinger Bands, ATR, and Fibonacci retracement.
Each indicator serves a different purpose. Some help identify trends, while others measure momentum, volatility, or possible price reversal areas.
For beginners, the goal is not to fill the chart with indicators. It is to understand how a few useful tools work together.
The basic principles of technical analysis of financial markets provide a starting point for examining gold prices and recognising market conditions.
This guide explains the best indicators for gold trading and how to use them in a practical trading plan.
What Is Gold Technical Analysis?
Gold technical analysis involves studying historical XAUUSD prices to understand market direction and identify possible trading opportunities.
XAUUSD represents gold priced in US dollars. Its price responds to global economic conditions, interest-rate expectations, geopolitical events, and changes in demand for gold.
Traders use gold technical charts to examine three important factors:
-
- Trend: Whether gold is moving upward, downward, or sideways.
-
- Momentum: How strongly the price is moving in a particular direction.
-
- Volatility: How widely and rapidly prices change.
Technical indicators organise this information into visual signals. However, they describe market behaviour rather than predict future prices with certainty.
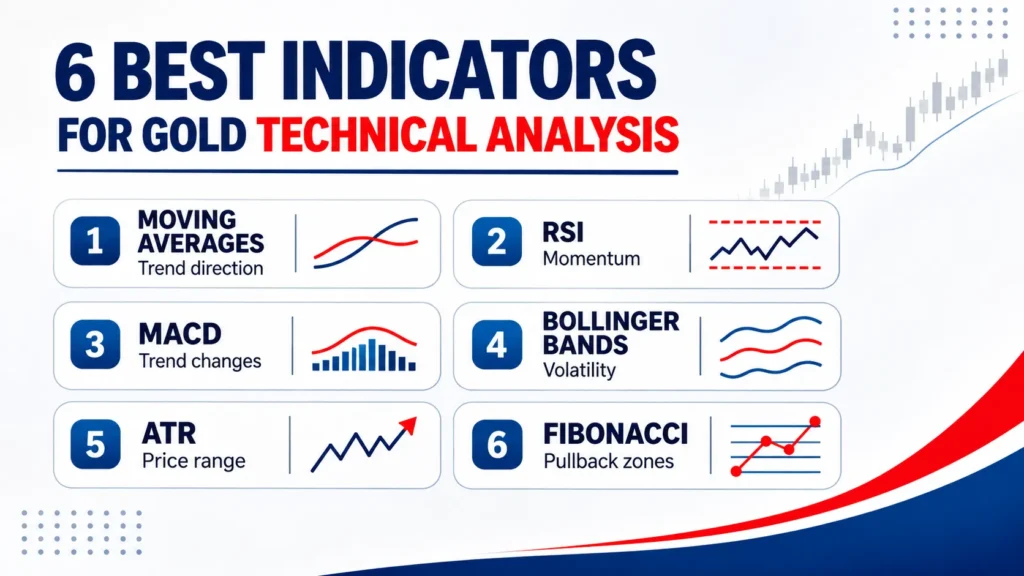
6 Best Indicators for Gold Technical Analysis
The following tools can help traders analyse gold prices across different market conditions.
1. Moving Averages – Identify Gold Price Trends
Moving averages help traders recognise the broader direction of XAUUSD by smoothing short-term price fluctuations.
The Simple Moving Average (SMA) calculates the average closing price over a selected period. The Exponential Moving Average (EMA) responds more quickly to recent changes.
Two commonly followed settings are:
Gold 50-day moving average: Used to assess the medium-term market direction.
Gold 200-day moving average: Used to observe the longer-term trend.
When gold trades above these averages, traders may interpret the market as showing upward strength. Trading below them can suggest weaker conditions.
The CME Group guide to moving averages explains how these lines can help traders assess trends and potential support or resistance.
Limitation: Moving averages react to past prices and may give delayed signals during sudden reversals.
2. RSI Indicator – Measure Gold Market Momentum
The Relative Strength Index (RSI) measures the speed and strength of recent price movements.
The RSI indicator for gold helps traders recognise when buying or selling pressure may be becoming stretched.
An elevated gold RSI reading can suggest strong upward momentum, while a low reading may indicate increased selling pressure.
Traders also study RSI divergence. This occurs when gold forms a new price high or low, but the indicator does not show matching strength.
Practical example: If XAUUSD reaches a new high while RSI forms a lower high, traders may watch for signs of weakening momentum.
Limitation: Gold can remain overbought or oversold during a strong trend. RSI alone is not a reliable reversal signal.
3. MACD – Recognise Changes in Gold Momentum
Moving Average Convergence Divergence (MACD) helps traders assess changes in trend direction and momentum.
It uses moving averages to create a MACD line, signal line, and histogram.
A crossover above the signal line may suggest strengthening upward momentum. A crossover below it may suggest increasing downward pressure.
For example, if gold breaks above resistance while MACD momentum strengthens, traders may see the signals as supporting each other.
However, a crossover after a large price movement may arrive too late for a suitable entry.
Limitation: MACD can produce misleading signals when gold moves sideways.
4. Bollinger Bands – Understand Gold Price Volatility
Bollinger Bands show how far the gold price moves around a central moving average.
The indicator contains an upper band, a middle line, and a lower band.
When the bands widen, gold is showing greater price variation. Narrow bands suggest a quieter market.
Some traders watch narrow bands for possible breakouts. Others examine how price reacts near the outer bands.
The Fidelity guide to technical analysis explains how Bollinger Bands and other indicators help traders evaluate price behaviour.
Limitation: Touching the upper or lower band does not automatically mean gold will reverse.
5. ATR – Measure XAUUSD Price Movement
Average True Range (ATR) measures how much gold typically moves over a selected number of trading periods.
Unlike trend indicators, ATR does not show whether the market will rise or fall.
Instead, it helps traders understand current price fluctuations.
For example, a rising ATR suggests that gold is moving through wider price ranges. Traders may need to reconsider position size and stop-loss distance during these conditions.
This becomes especially relevant when market activity changes around gold trading hours.
Limitation: ATR measures movement size, not future market direction.
6. Fibonacci Retracement – Find Potential Pullback Areas
Fibonacci retracement helps traders mark possible support and resistance areas within an established price movement.
The tool is drawn between a significant swing high and swing low.
For example, after a strong gold rally, traders may use Fibonacci levels to identify areas where a pullback could pause.
These levels become more useful when they align with previous support, resistance, or moving averages.
Limitation: Fibonacci levels are reference areas, not guaranteed turning points.
How to Use Gold Technical Analysis in Trading
Understanding individual indicators is useful, but combining them with price action creates a more structured approach.
Step 1: Identify the Main Trend
Open a gold price chart and check the broader direction.
A moving average can help determine whether the market is trending or ranging.
Step 2: Mark Important Price Levels
Identify previous highs, lows, support, and resistance areas.
These levels help traders understand where buying or selling activity previously influenced the price.
Step 3: Check Momentum
Use RSI or MACD to assess whether current price movement has supporting momentum.
Avoid making trading decisions from a single indicator reading.
Step 4: Evaluate Volatility
Check ATR or Bollinger Bands to understand the current trading environment.
During major economic announcements, gold can move quickly and produce unexpected execution prices.
Step 5: Plan Risk Before Trading
Consider potential entry and exit levels, transaction costs, and position size.
Traders using automated systems should also understand how a Gold EA applies technical indicators through programmed trading rules.
Automation does not remove the possibility of losses.
Common Gold Technical Analysis Mistakes
Even useful indicators can lead to poor decisions when applied without context.
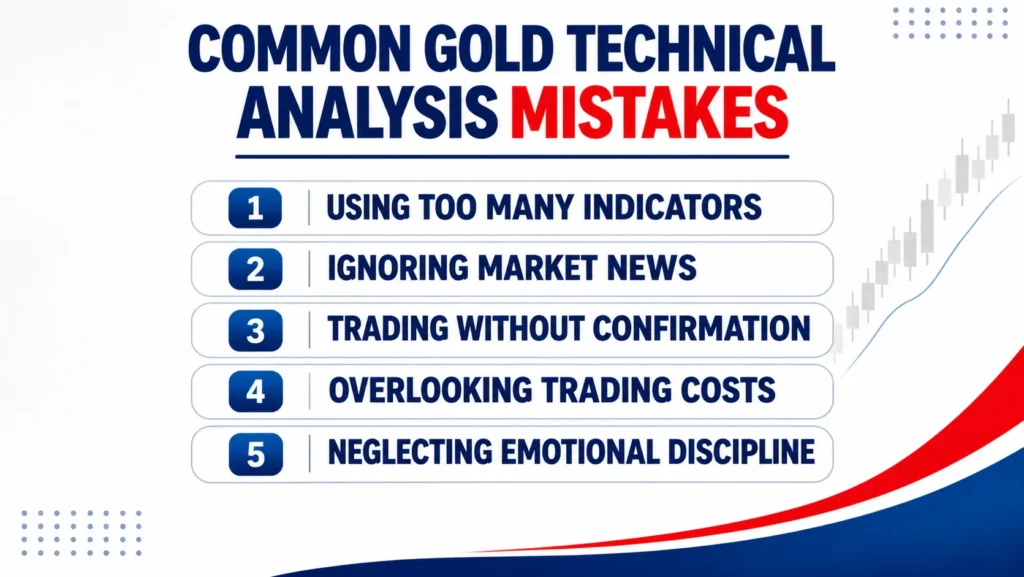
Using too many indicators: Several tools measuring similar conditions can create confusion rather than clarity.
Ignoring market news: Gold can react sharply to inflation reports, interest-rate decisions, and geopolitical developments.
Trading without confirmation: A single crossover or RSI reading does not establish a complete trading setup.
Overlooking trading costs: Spreads, slippage, and financing charges can affect the outcome of gold trades.
Neglecting emotional discipline: A clear understanding of trading psychology can help traders follow their plans rather than react impulsively.
Conclusion
Gold technical analysis provides a practical framework for understanding XAUUSD trends, momentum, and volatility.
Moving averages, RSI, MACD, Bollinger Bands, ATR, and Fibonacci retracement each offer different insights. Using a small selection of complementary indicators is generally more practical than relying on many overlapping signals.
Traders should combine chart observations with market awareness, realistic expectations, and careful risk management.
When evaluating outside trading alerts, understanding how to use free forex signals can help traders assess the information rather than follow it blindly.
Frequently Asked Questions
There is no single best indicator for every condition. Moving averages help identify trends, RSI measures momentum, and ATR tracks volatility. Combining complementary tools can provide broader context.
Beginners can start by identifying the trend, marking support and resistance, and using one momentum indicator. Practising chart analysis before trading real funds is important.
RSI is useful for studying momentum extremes and divergence. MACD focuses on changes in momentum and trend. Their usefulness depends on the trading strategy.
The gold 200-day moving average helps traders assess longer-term price direction. However, it responds slowly to market changes and should not determine trades on its own.
Gold technical analysis today can describe current chart conditions, but it cannot reliably predict the exact future price. Economic news and unexpected events can quickly change market direction.